Hernando de Soto Bridge
Project Overview
The Hernando de Soto bridge, first opened in 1973, carries I-40 traffic across the Mississippi river. During a seismic retrofit, sudden settlement of a pier supporting an approach bridge, forced temporary closure. The pier had settled 5 inches in three days.
After evaluating the failure, engineers revised construction methods and resumed work. Continuous settlement monitoring was mandated both to verify the effectiveness of the new method and to ensure the safety of traffic. GEO-Instruments was contracted to install and operate the monitoring system.
System Requirements
The monitoring system was required to:
• Provide hourly updates on the position of the piers in the test area.
• Send alarm notifications if any movements exceed a specified value.
Traditional settlement monitoring instruments, such as rod extensometers, would be destroyed by underpinning activities around and under the piers. Remote sensing, such as optical surveys, was needed, but survey crews would be far too expensive and slow to deliver data. It was clear that measurements, processing, and reporting of results and alarms had to be automated. GEO-Instruments proposed an automated optical survey solution using AMTS monitoring systems (automated motorized total stations).
On-Site Implementation
Four AMTS and 48 L-Bar Prisms were installed on the piers. Each pier had at least two prisms, one high and one low. Each AMTS was fitted with a prism as well. Control prisms, set outside the area influenced by construction activities, provided a shared, stable point of reference for the AMTS.
The AMTS units were programmed to acquire hourly readings of the target and control prisms. Small data loggers collected and transmitted the readings to GEO-Instruments via cellular modems.
Off-Site Implementation
GEO’s web-based automated monitoring platform received the readings, processed them, checked for alarm conditions, and then posted the results on a dedicated project website a few minutes later. The AMTS readings were passed through GEO’s Monstar software for least-squares corrections and then formatted for the project website.
The project website presented the results in data tables, trend plots, and color-coded overlays on a plan view of the site. Since the results were posted on a website, they were immediately available everywhere. Any alarm notifications were sent out via email or text messages.
Conclusion
Monitoring the piers with AMTS proved to be a good solution:
• Data provided confidence that settlements were in the expected range and confirmed that the new methods were working.
• The continuous monitoring provided safety.
• The automated solution was more practical and less expensive than manual monitoring.
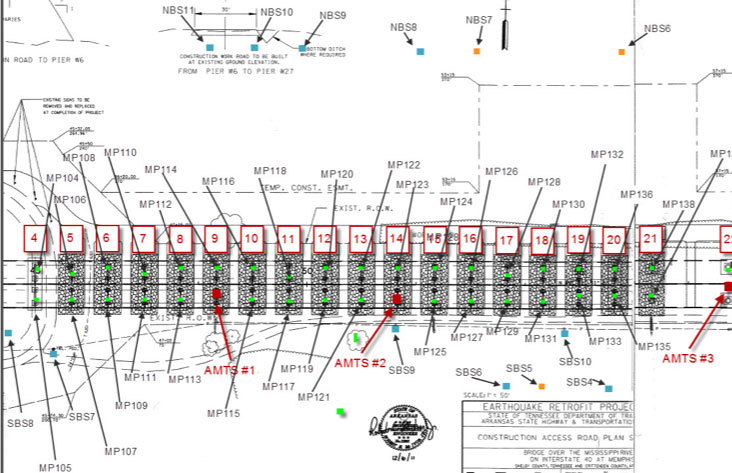
This planview was automatically updated every hour, showing the status of every pier. Color codes show alarms
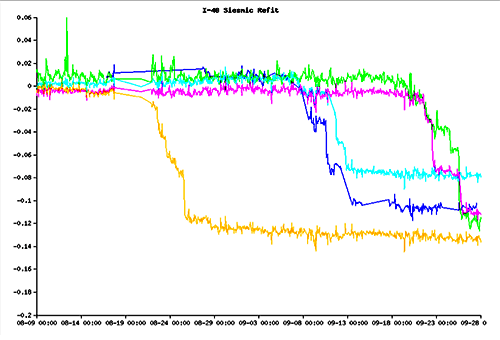
Preconfigured plots display measurements from groups of prisms.
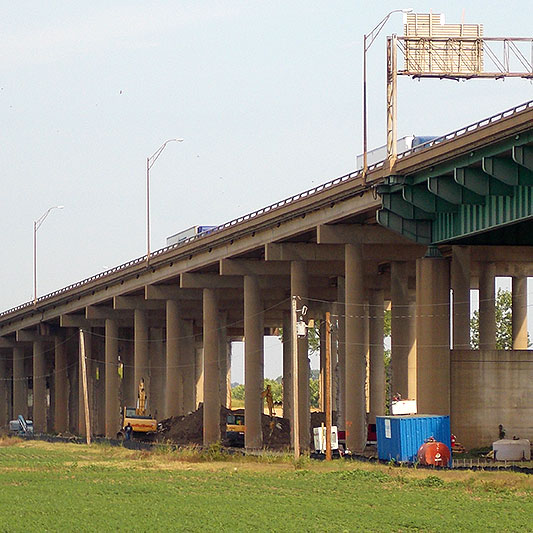
Continuous monitoring of the seismic retrofit project was mandated after unexpected settlement of a pier.
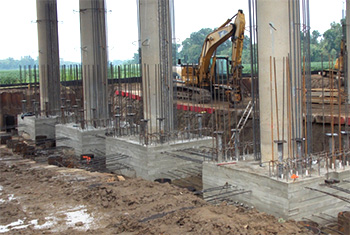
Remote sensing was required because insitu instruments would be destroyed.
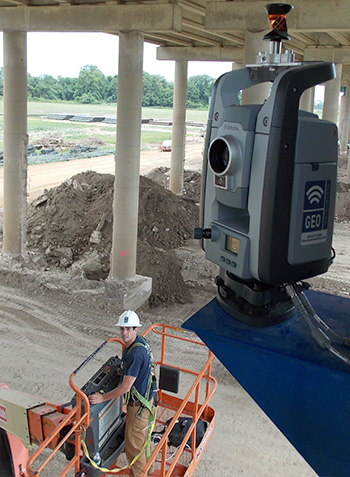
Four AMTS systems were installed to monitor prisms installed on the piers.
