Apollo Data Visualization
The Apollo Data Visualization application runs on GeoCloud servers to provide continuous graphical access to instrumentation data. Apollo Datasheet
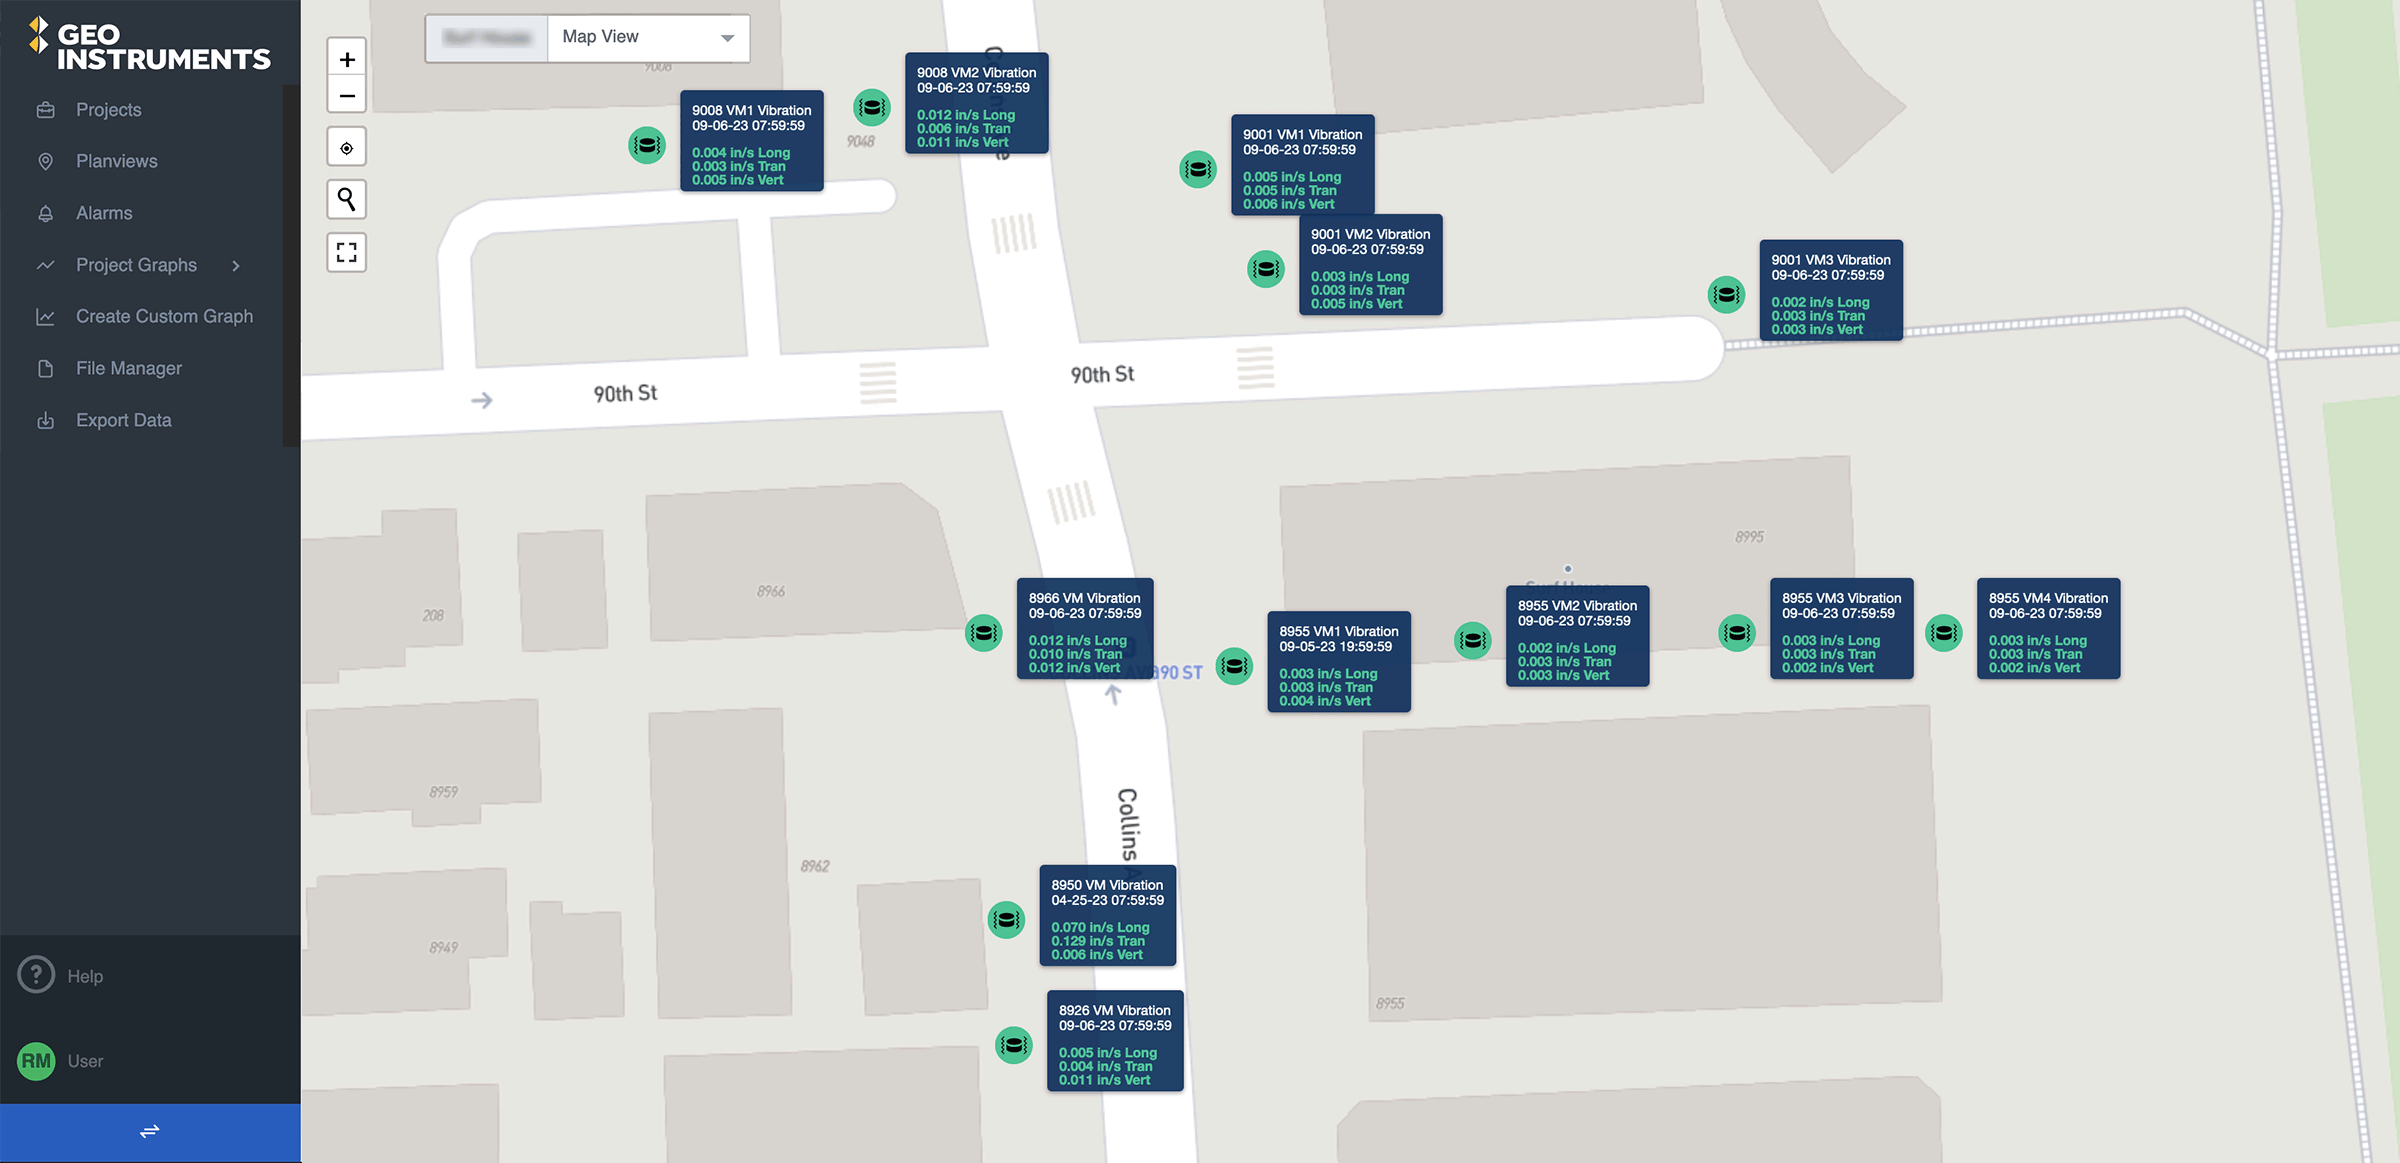
Planviews
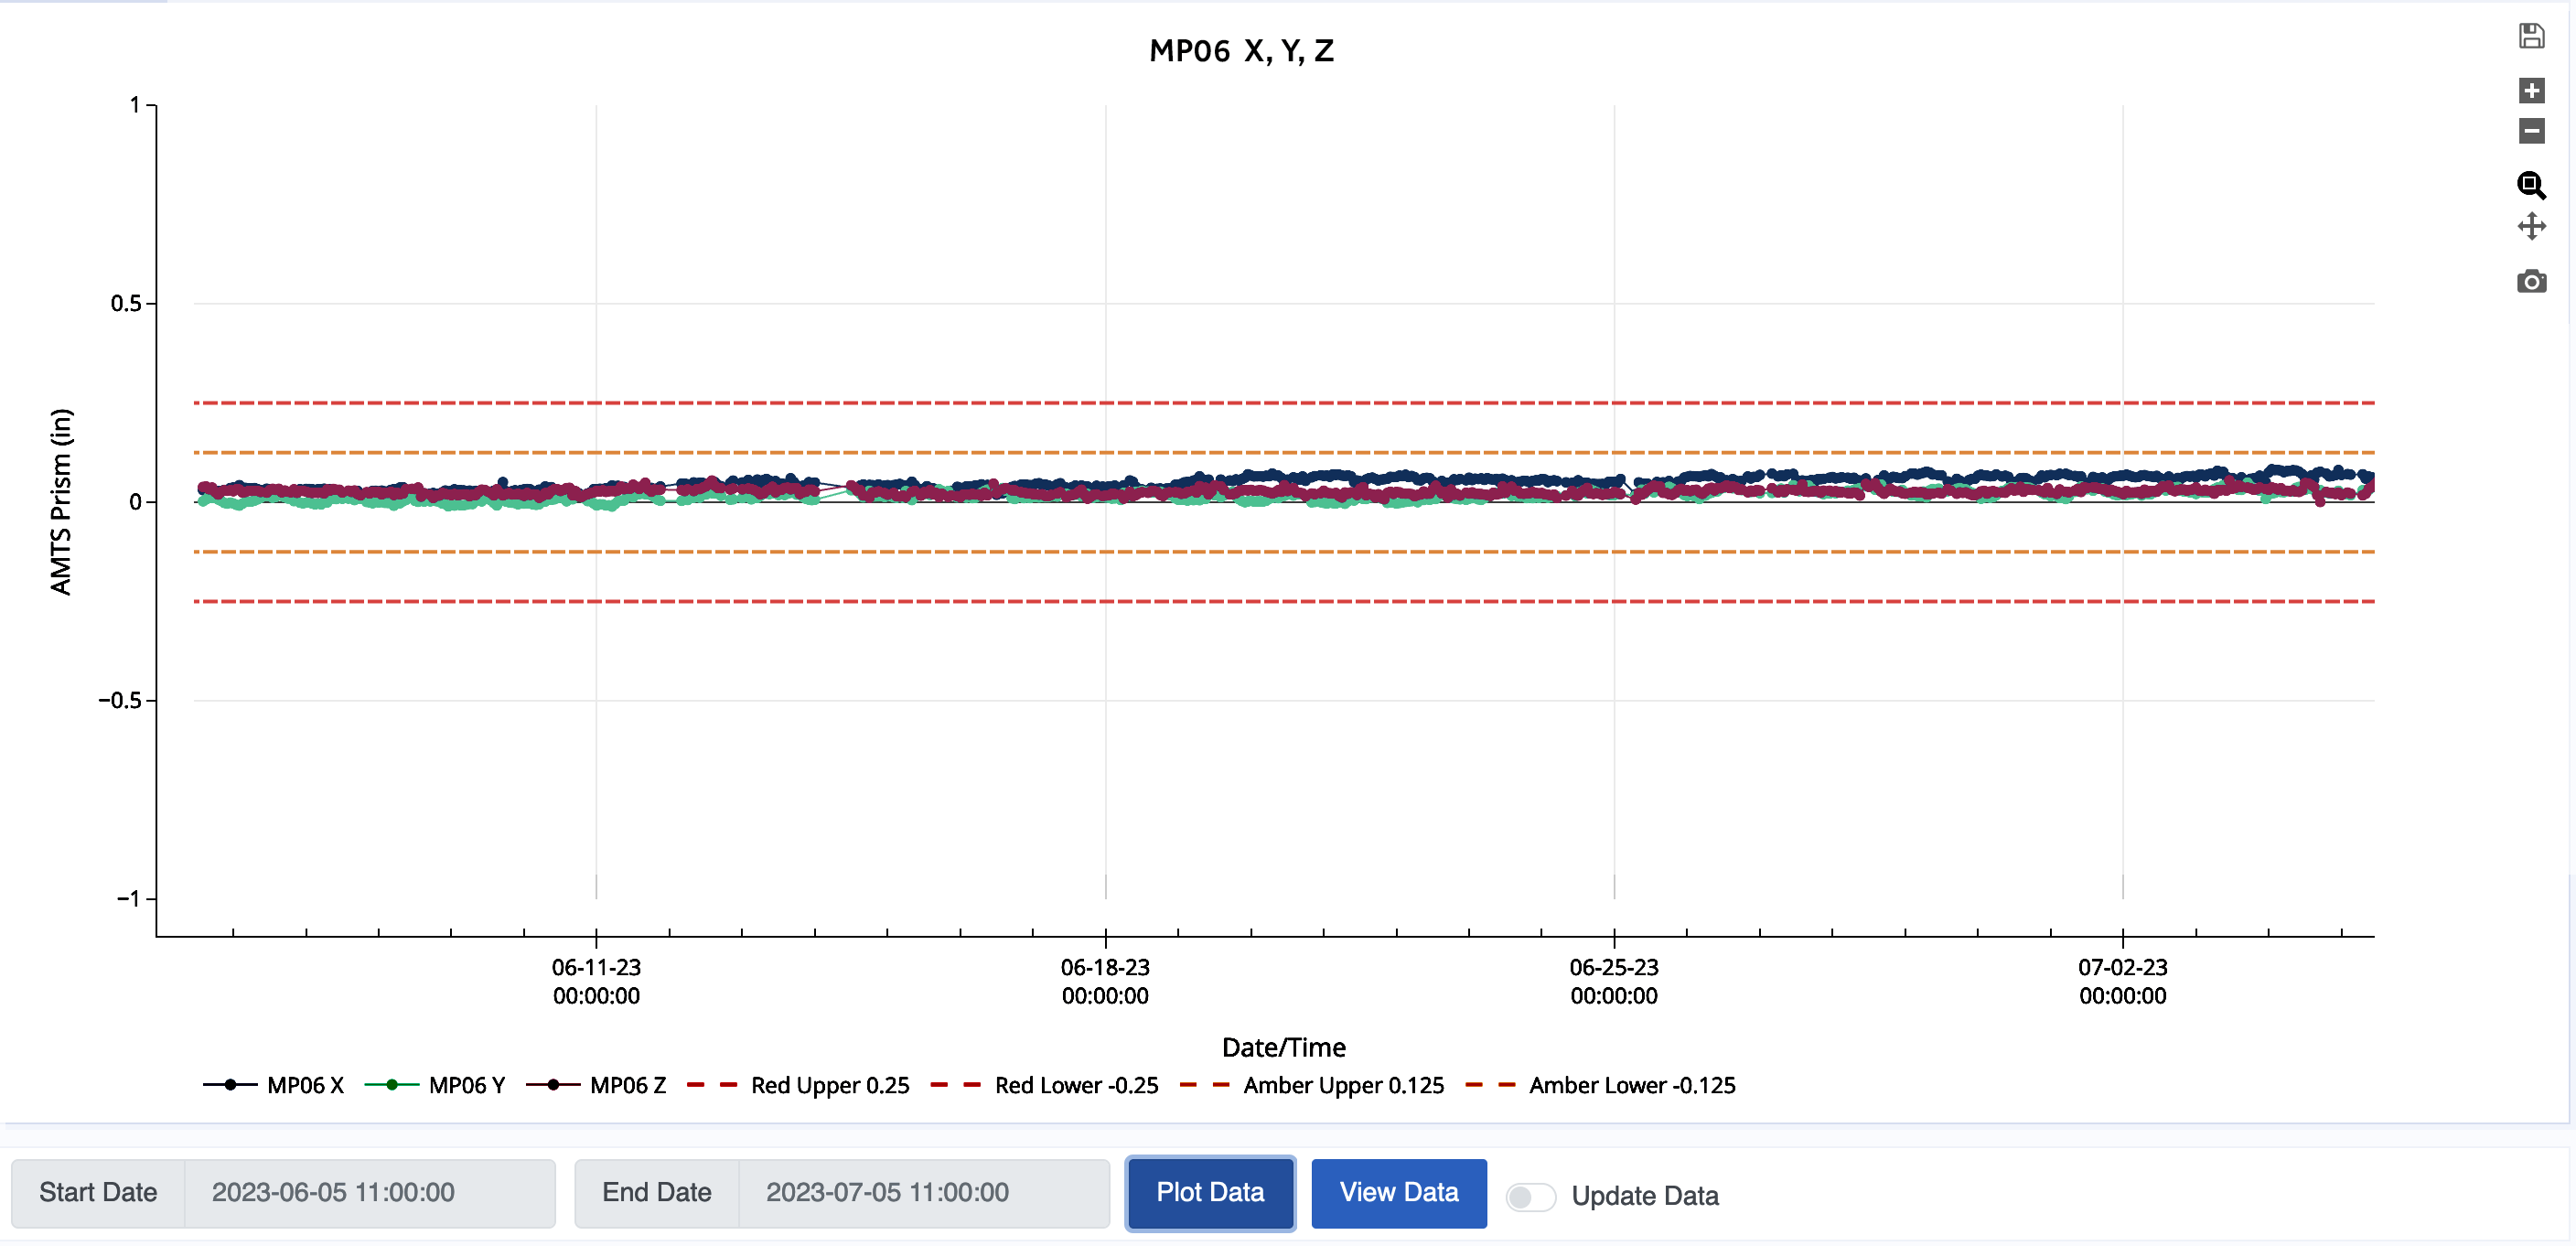
Graphs
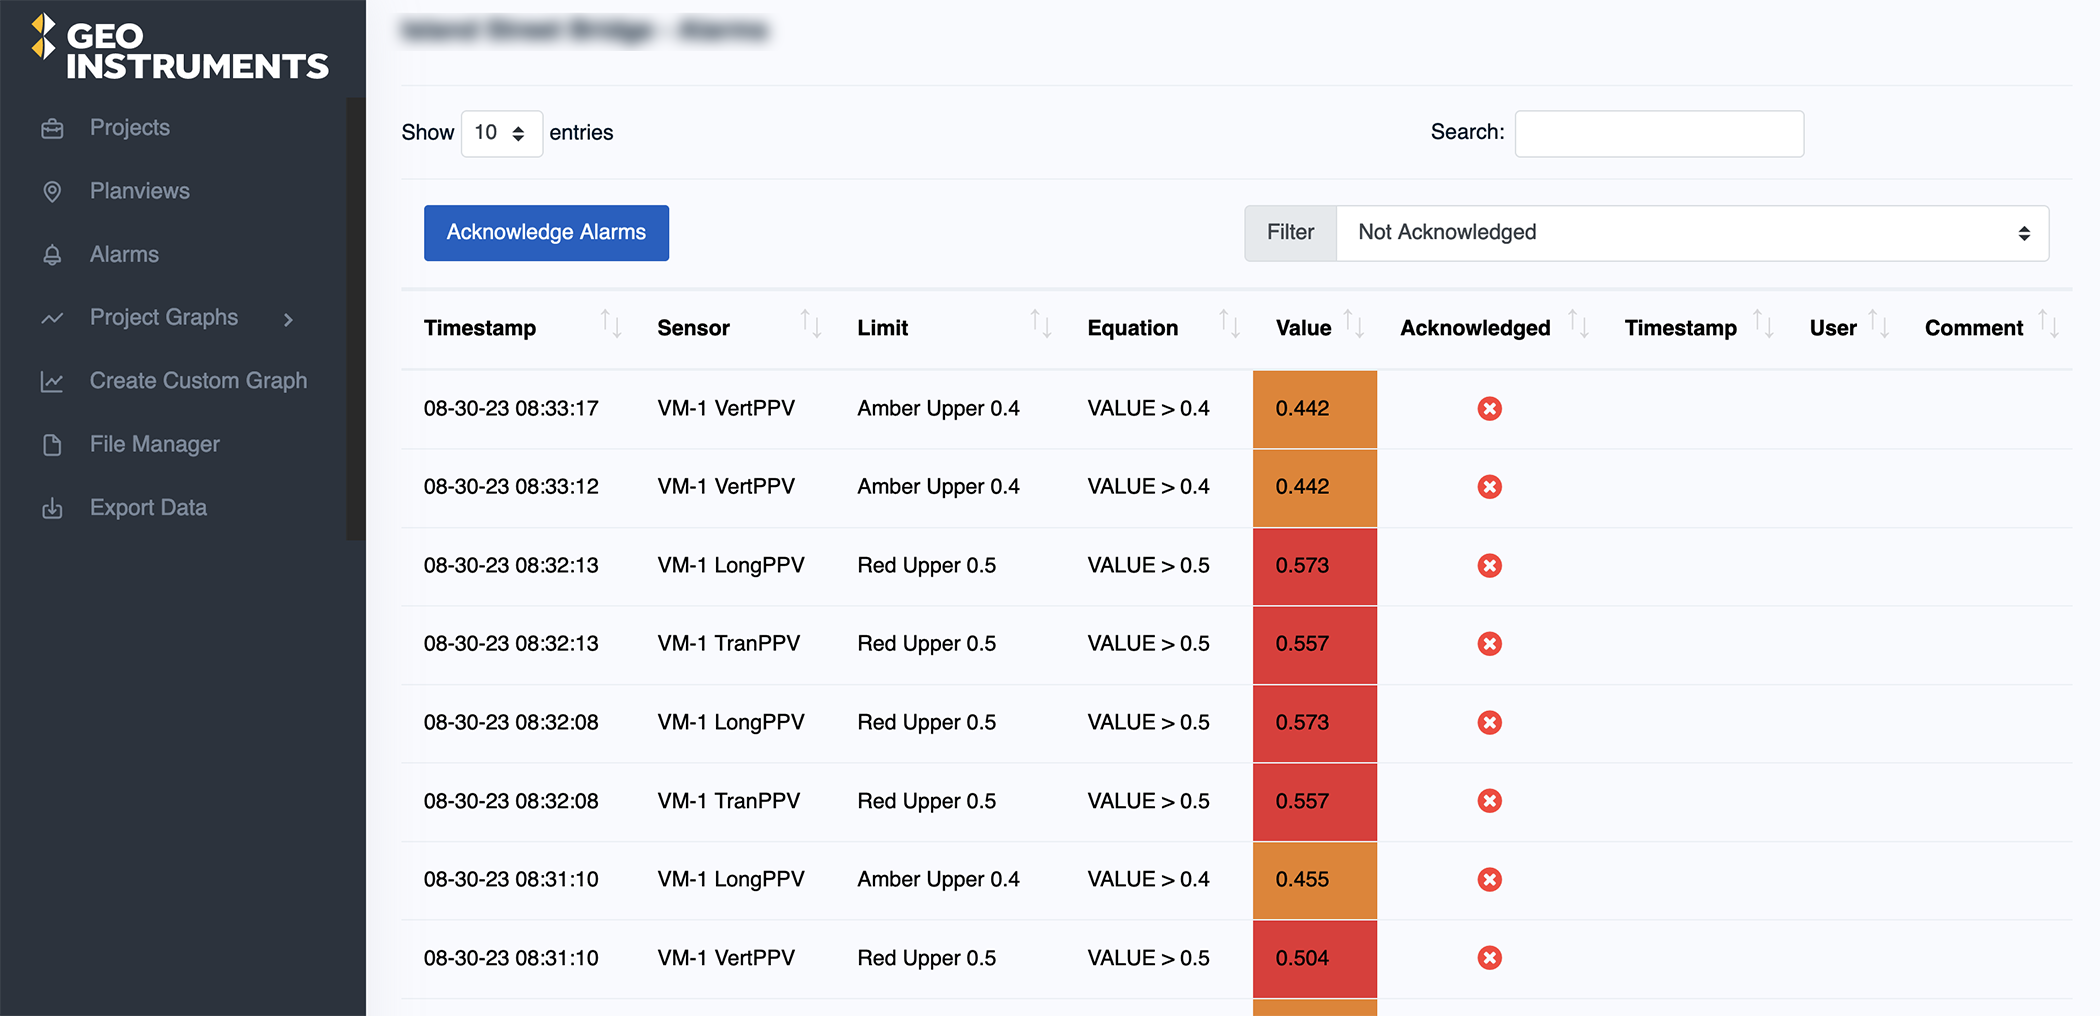
Alarms
Simple Interface: Apollo hides its powerful functionality behind a simple, easy-to-use interface. Measurements are visualized via Planviews and Graphs.
Consistent Calculations: Apollo processes data according to instructions stored in the project database.
Consistent Presentations: Planviews, project graphs, and reports are preconfigured to ensure consistent scales, terminology, and sensor selection.
Broad Compatibility: Specialized processing agents provide rapid handling of incoming data and extend Apollo’s compatibility to almost any type of monitoring device.
Easy Access: Apollo provides access to data wherever there is an internet connection. It works with web browsers on any platform.
Centralized Data Storage: Apollo stores all measurements in the project database, maintaining traceability, eliminating data silos, and simplifying access.
Planviews

Planviews show sensors and their current readings superimposed on a graphical base layer.
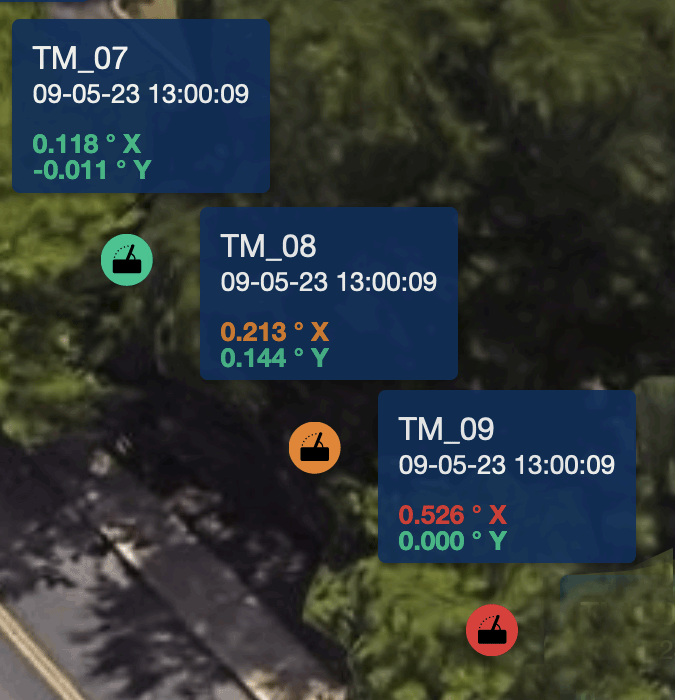
Alarm Status: Sensors and readings change color to show alarm status.
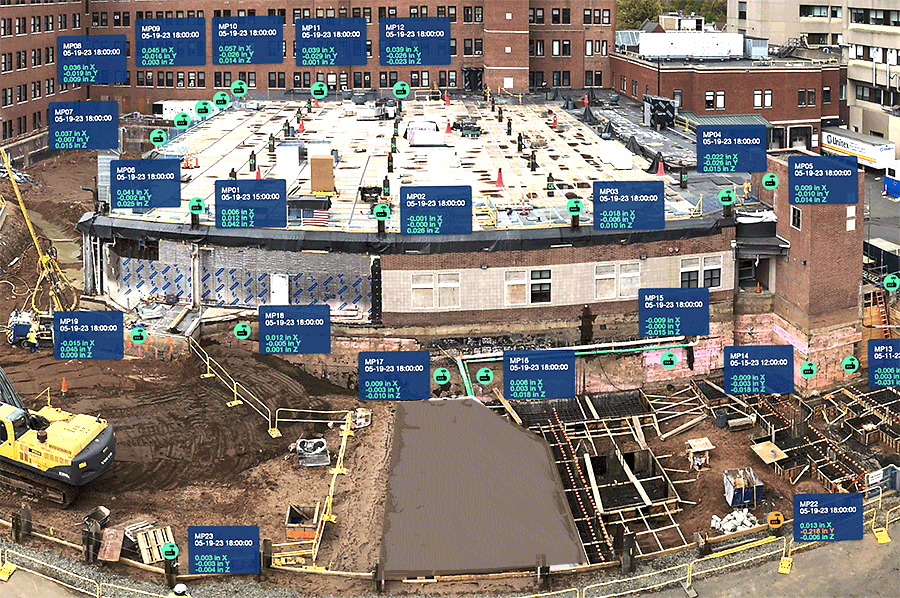
Photo as Base Layer
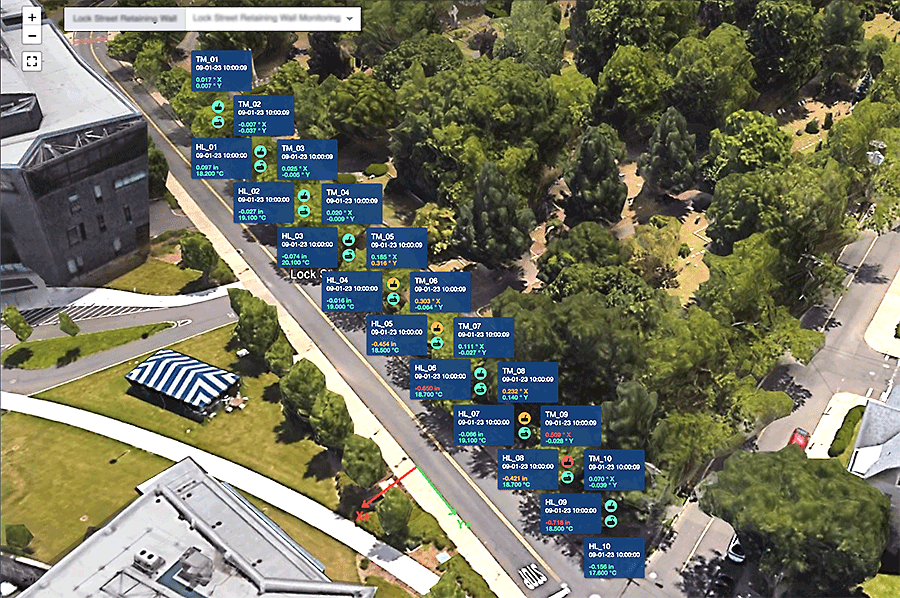
Satellite Map as Base Layer
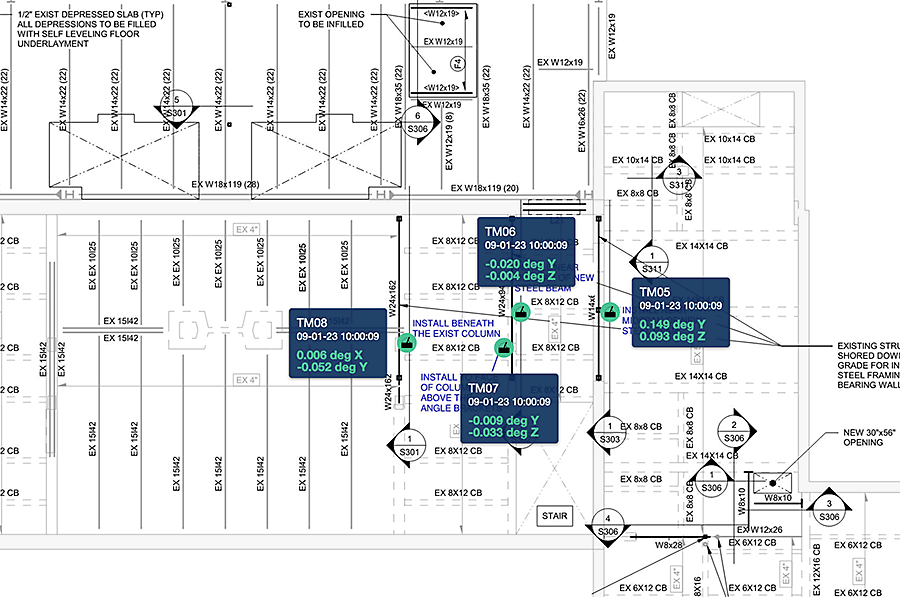
CAD Drawing as Base Layer
Graphs

Project graphs are preconfigured to customer requirements. Custom graphs, with free selection of sensors, are useful for adhoc investigations. Sensors and alarm limits can be toggled on and off for both project and custom graphs.
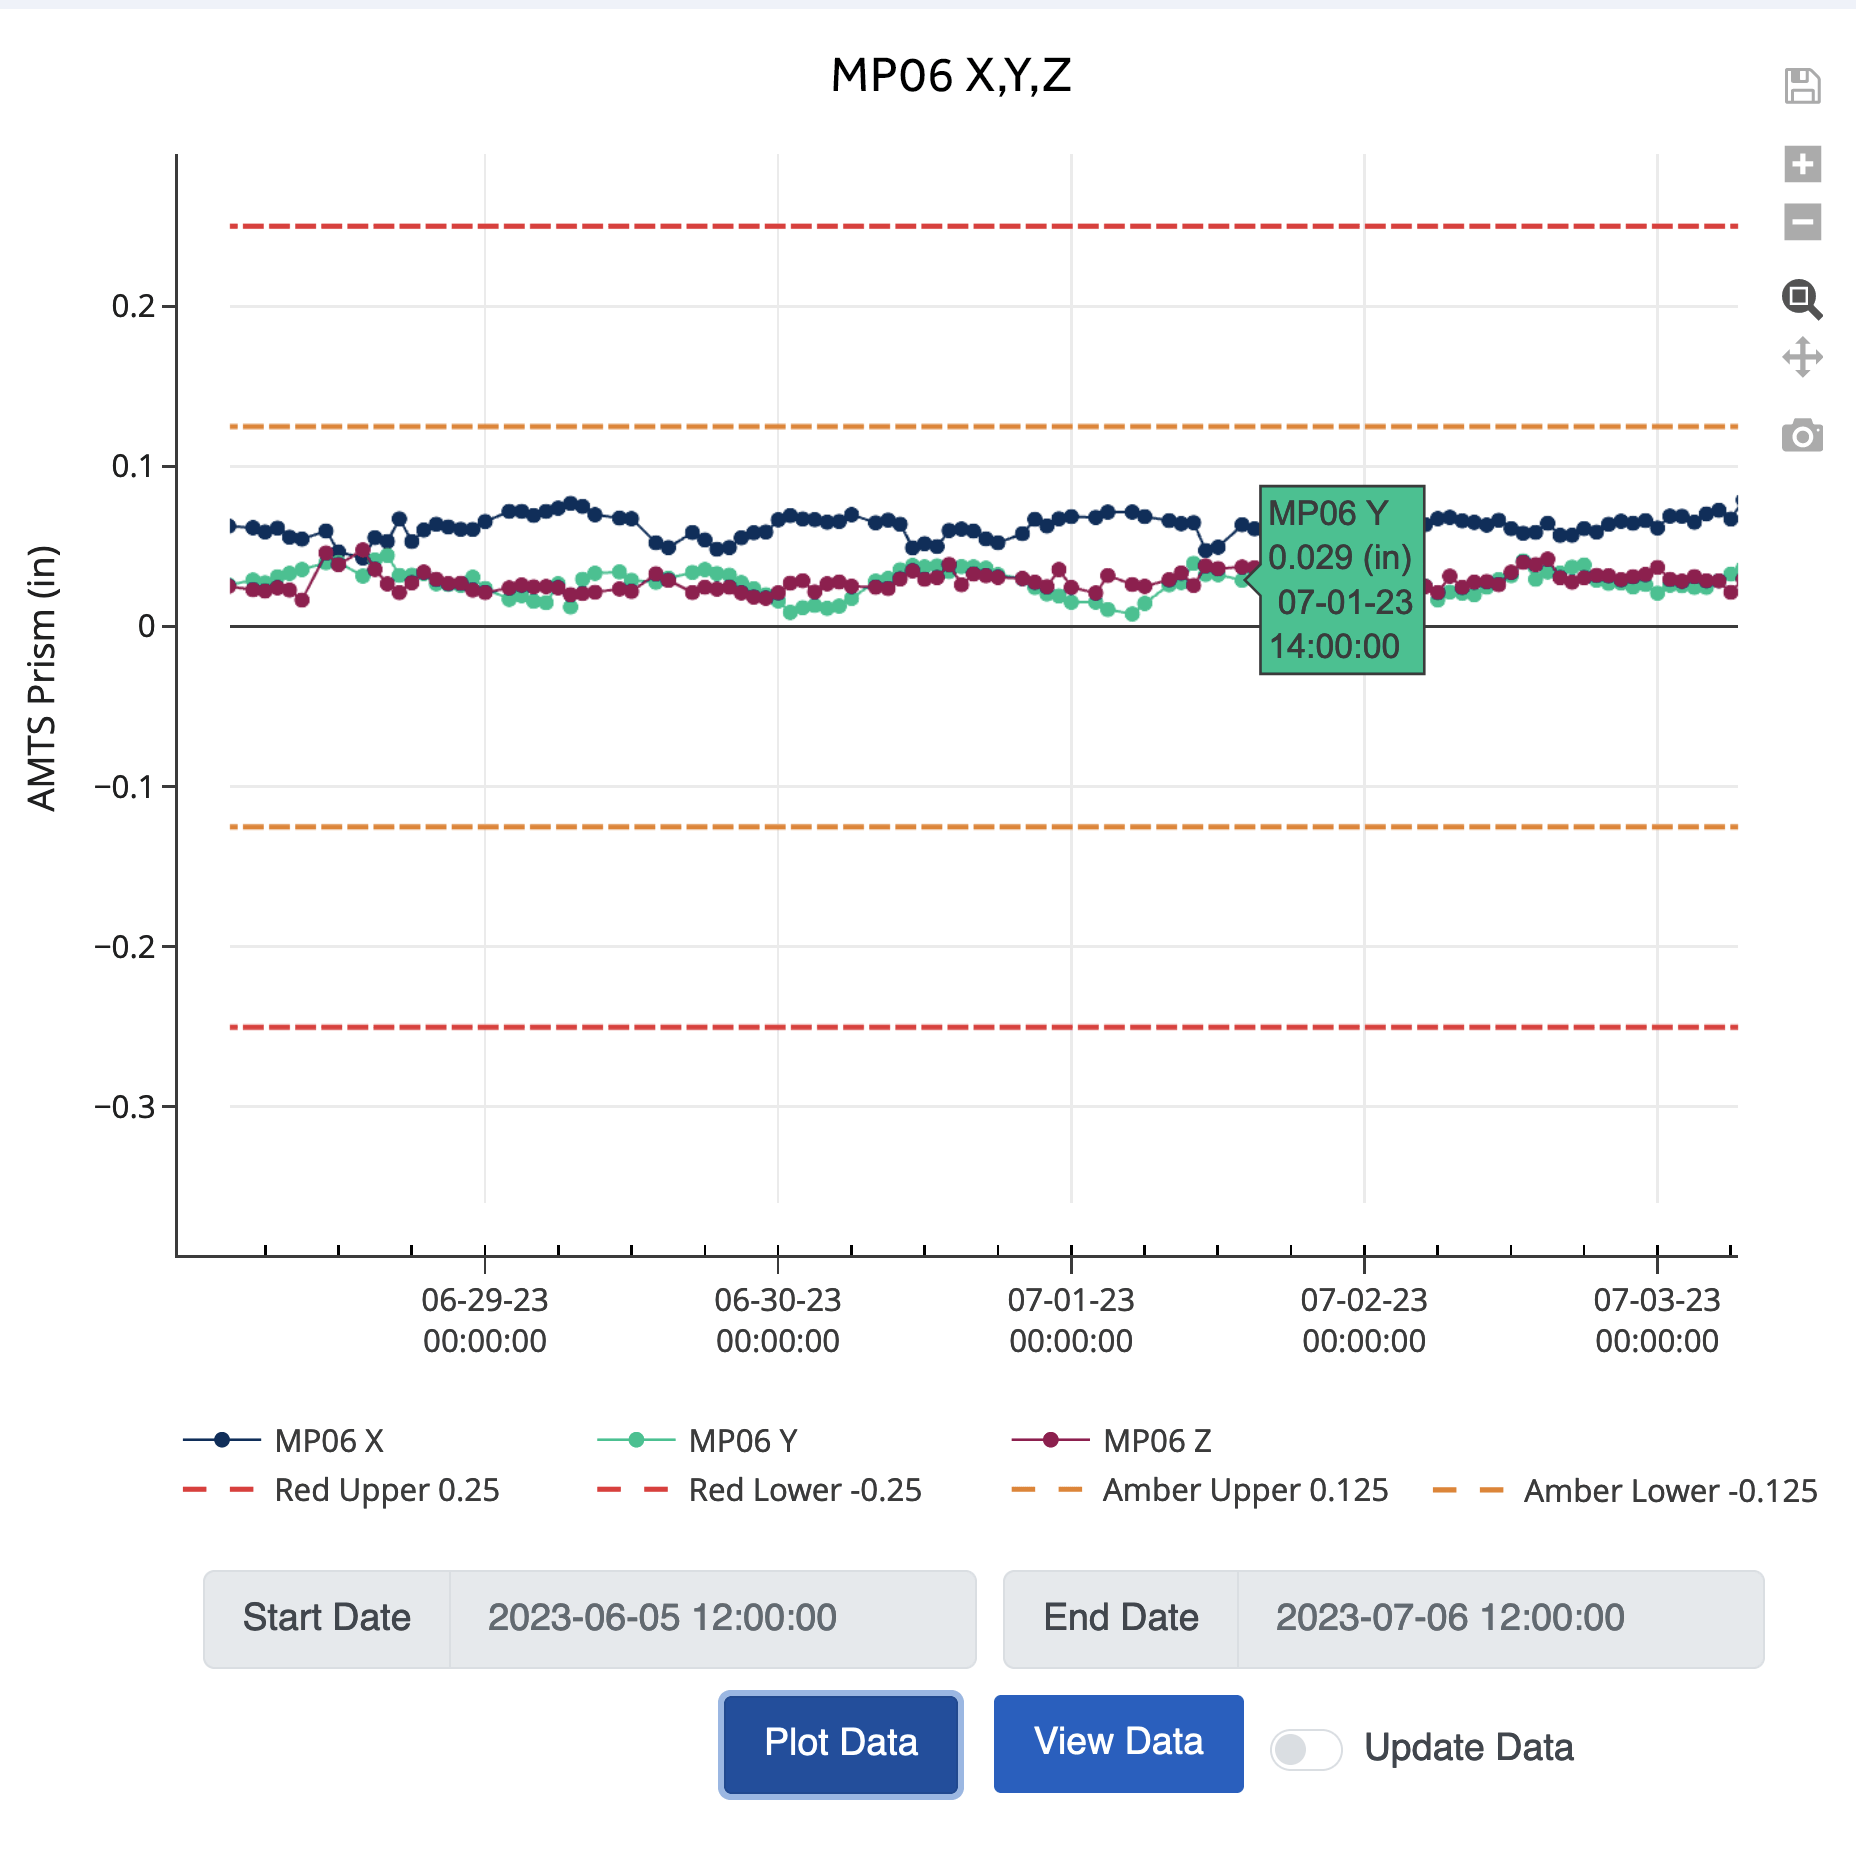
Inspection: a data readout, as shown above, follows movement of the cursor. Icons at the top right provide zoom and export options.
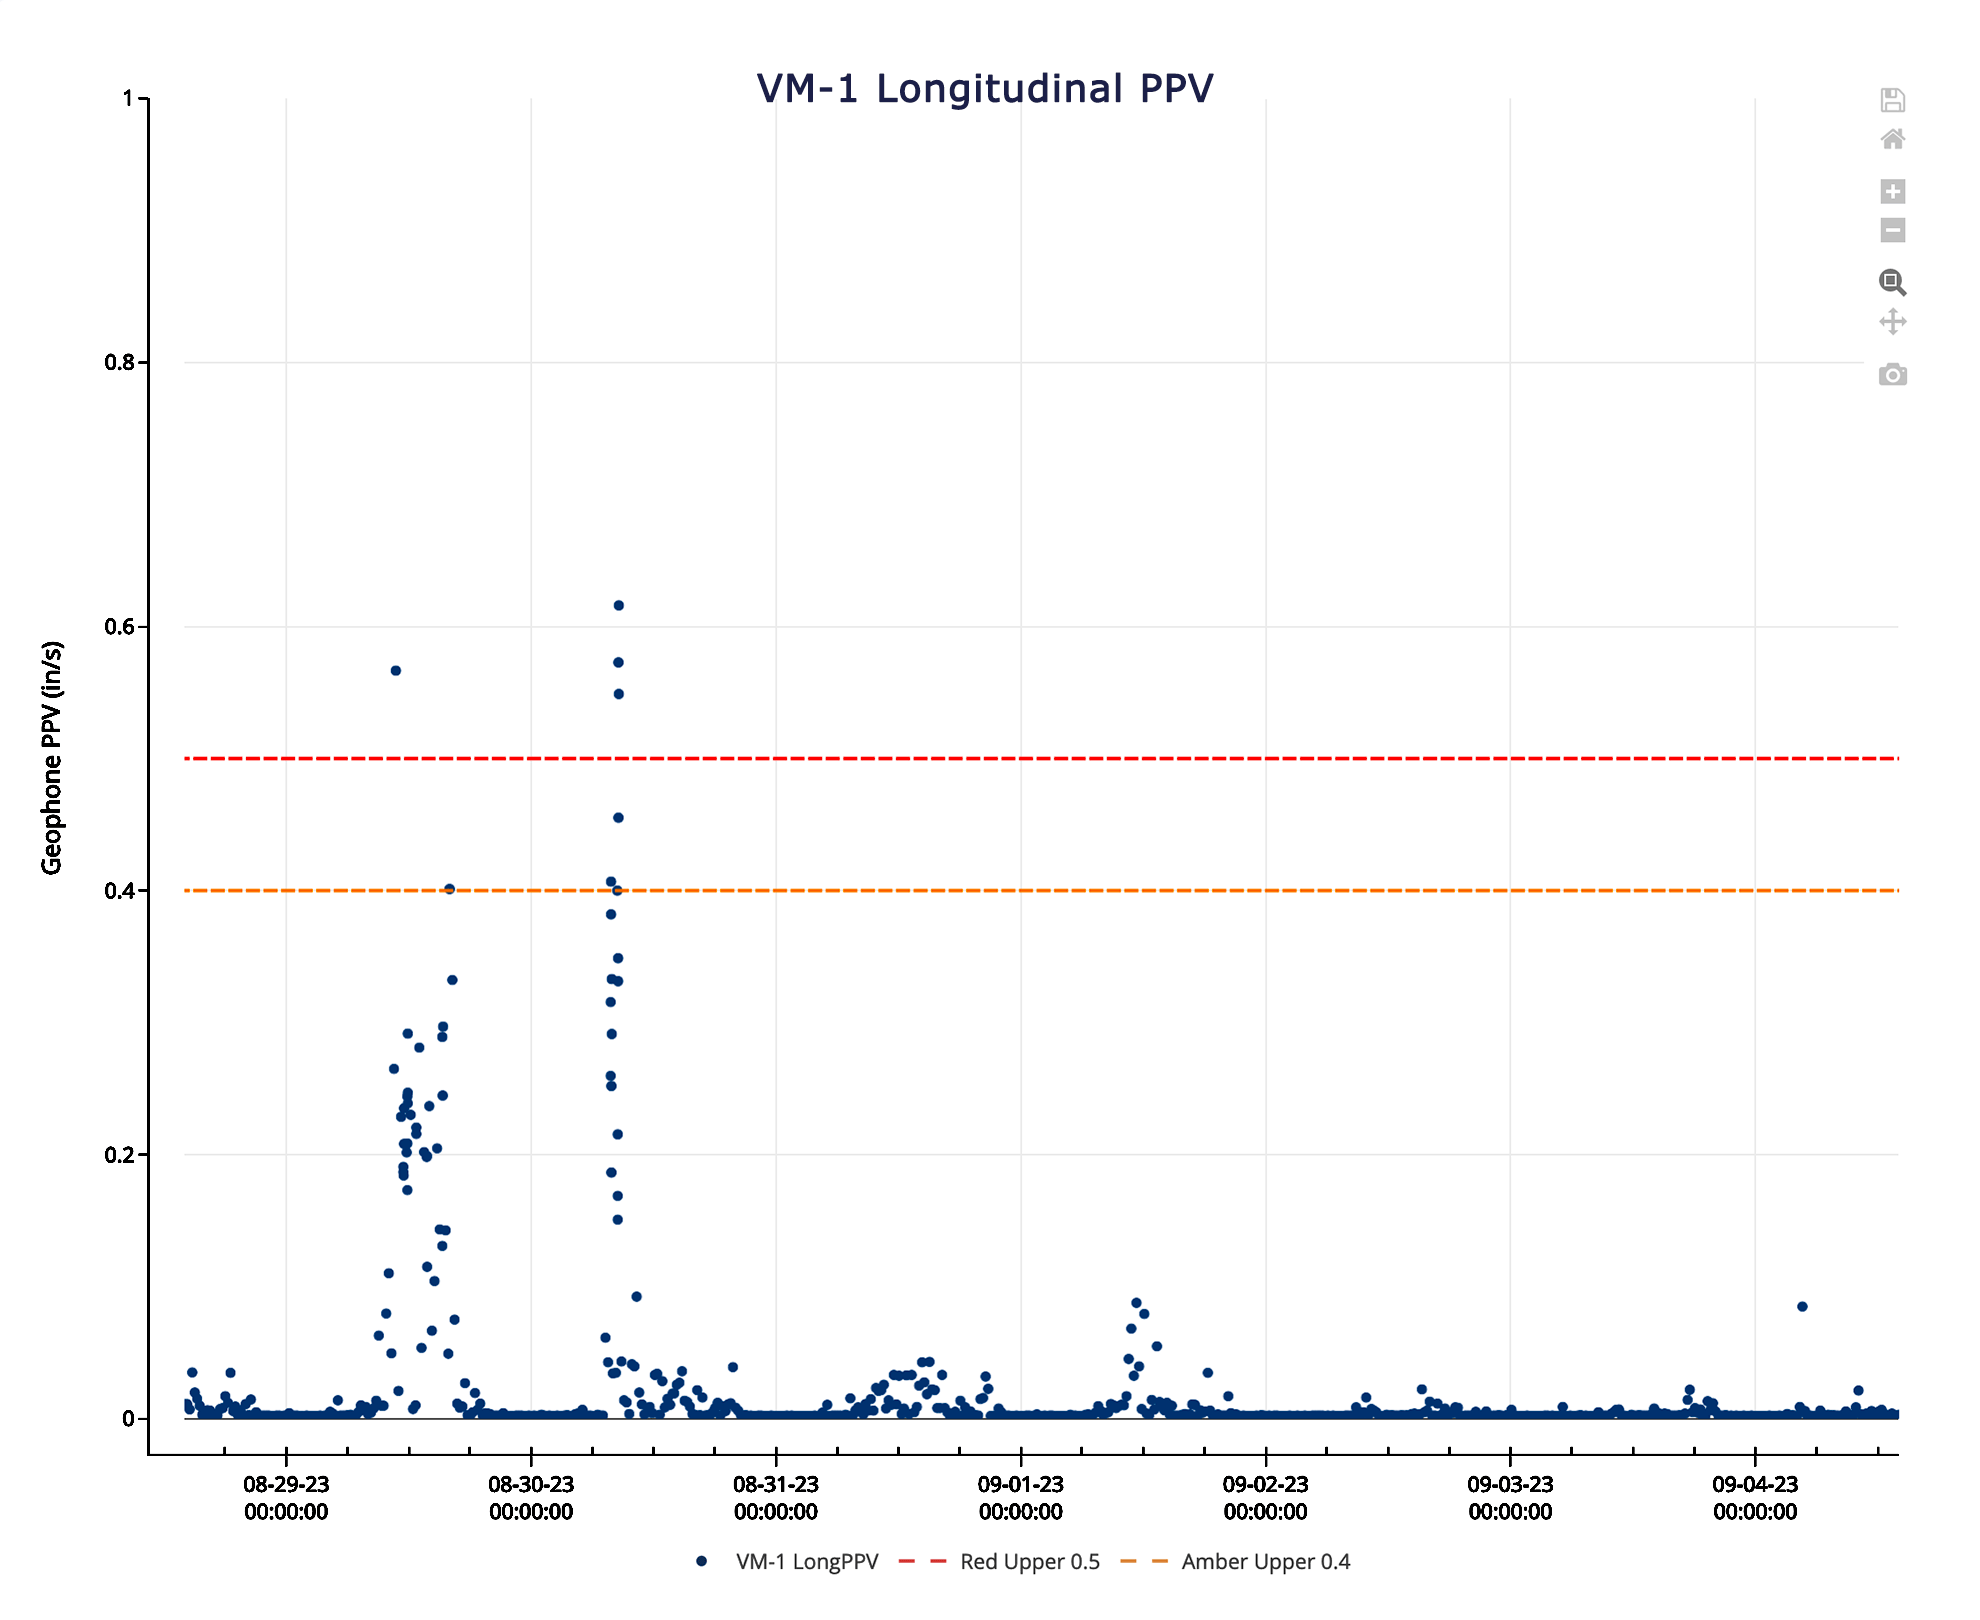
PPV Histogram
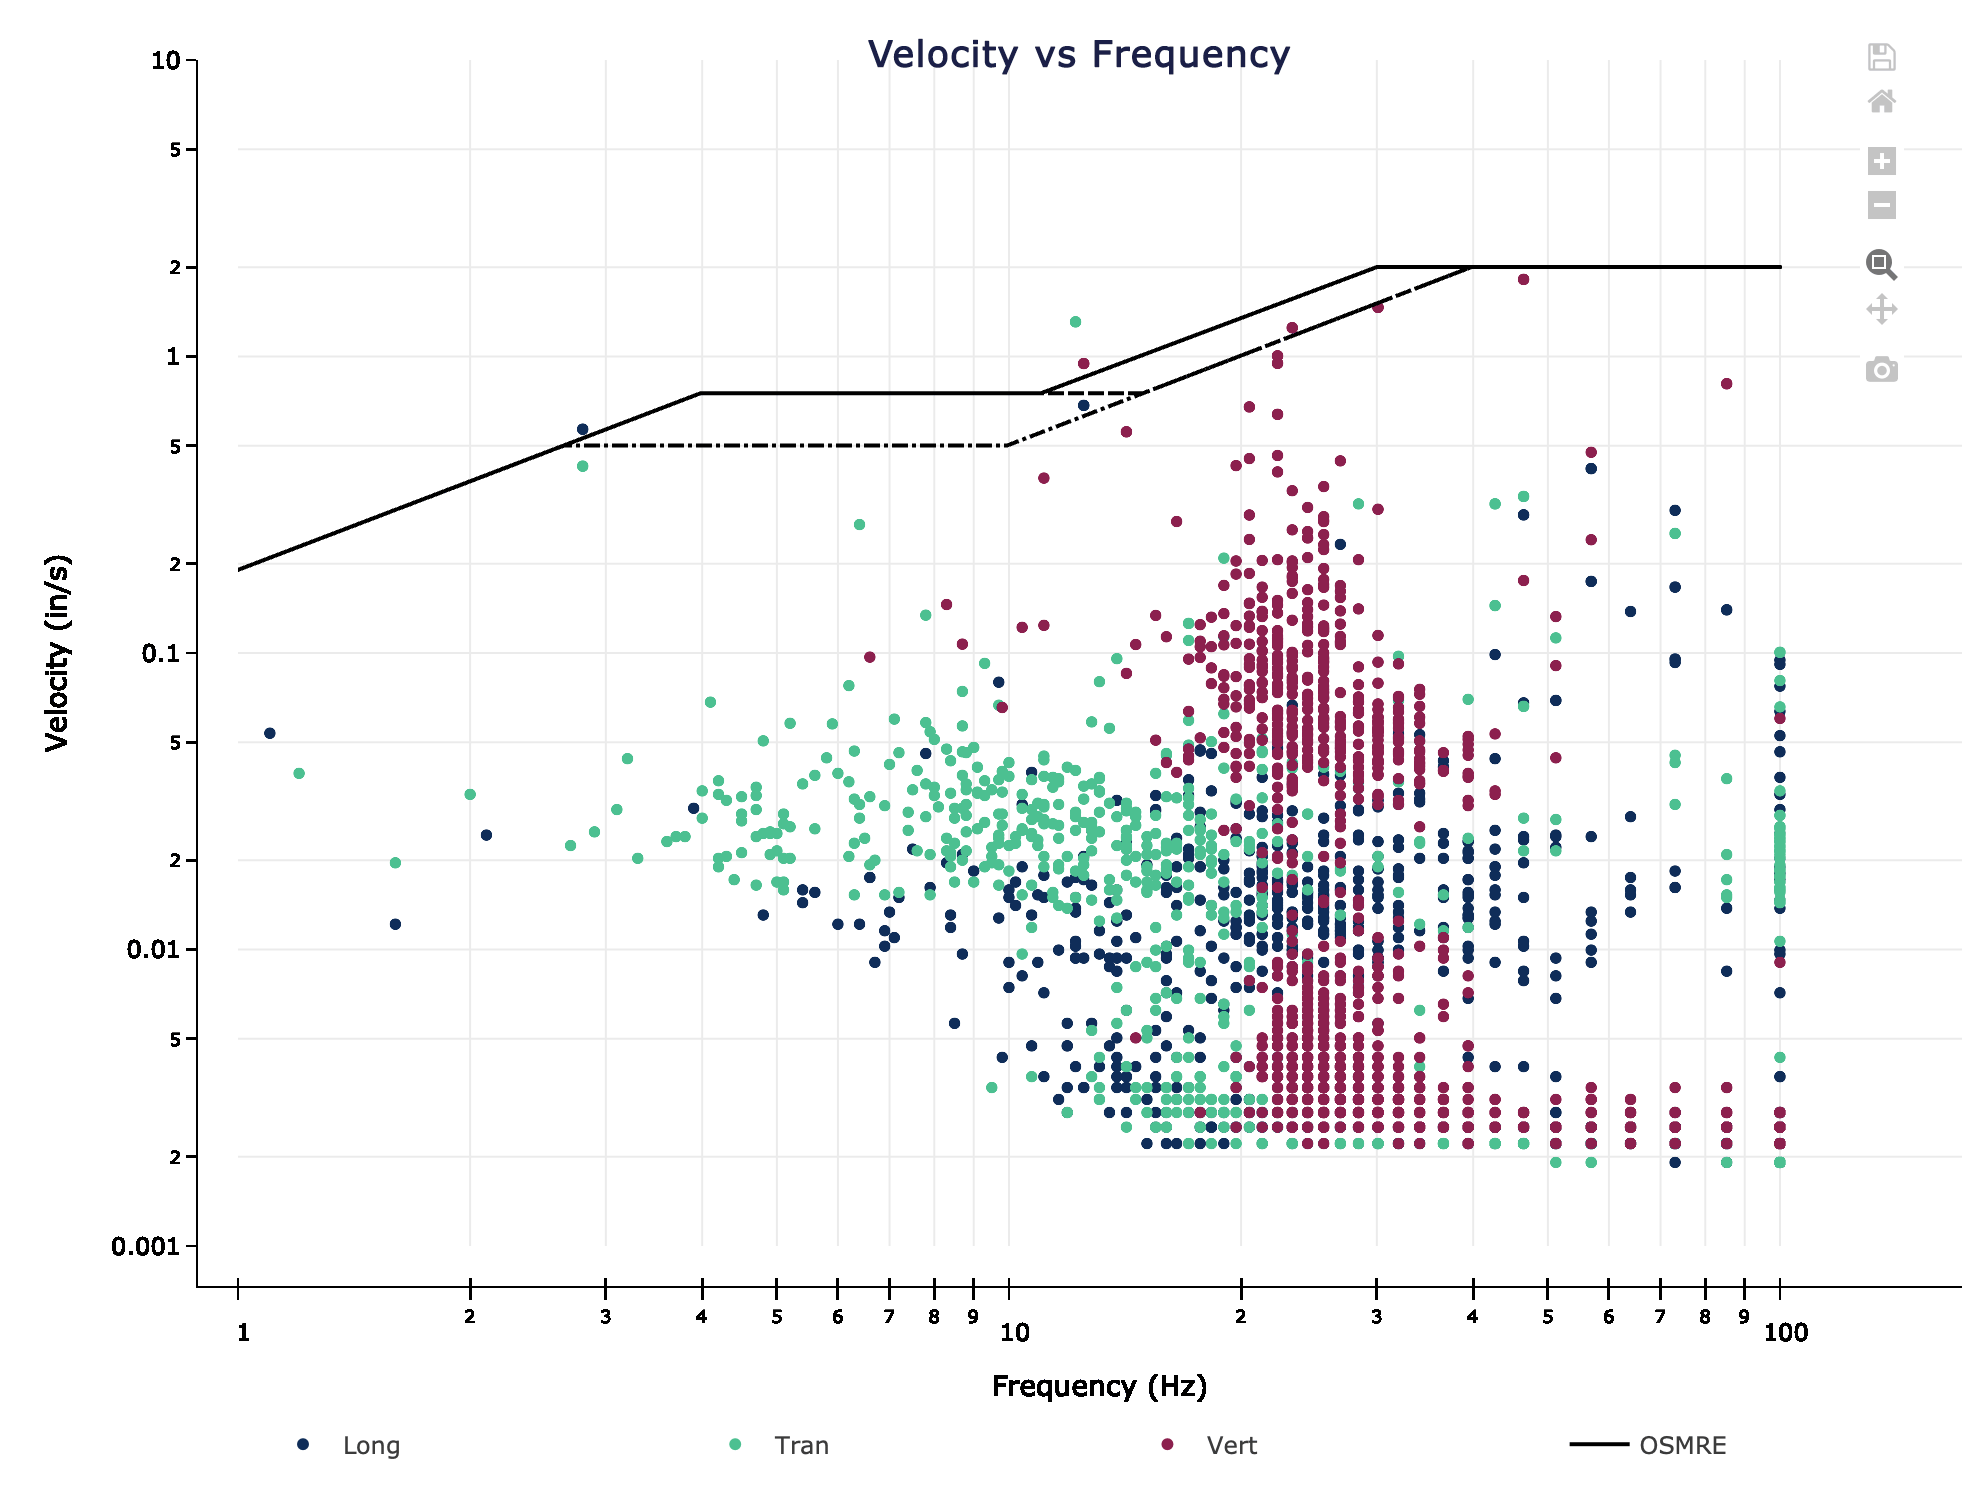
USBM OSMRE Plot
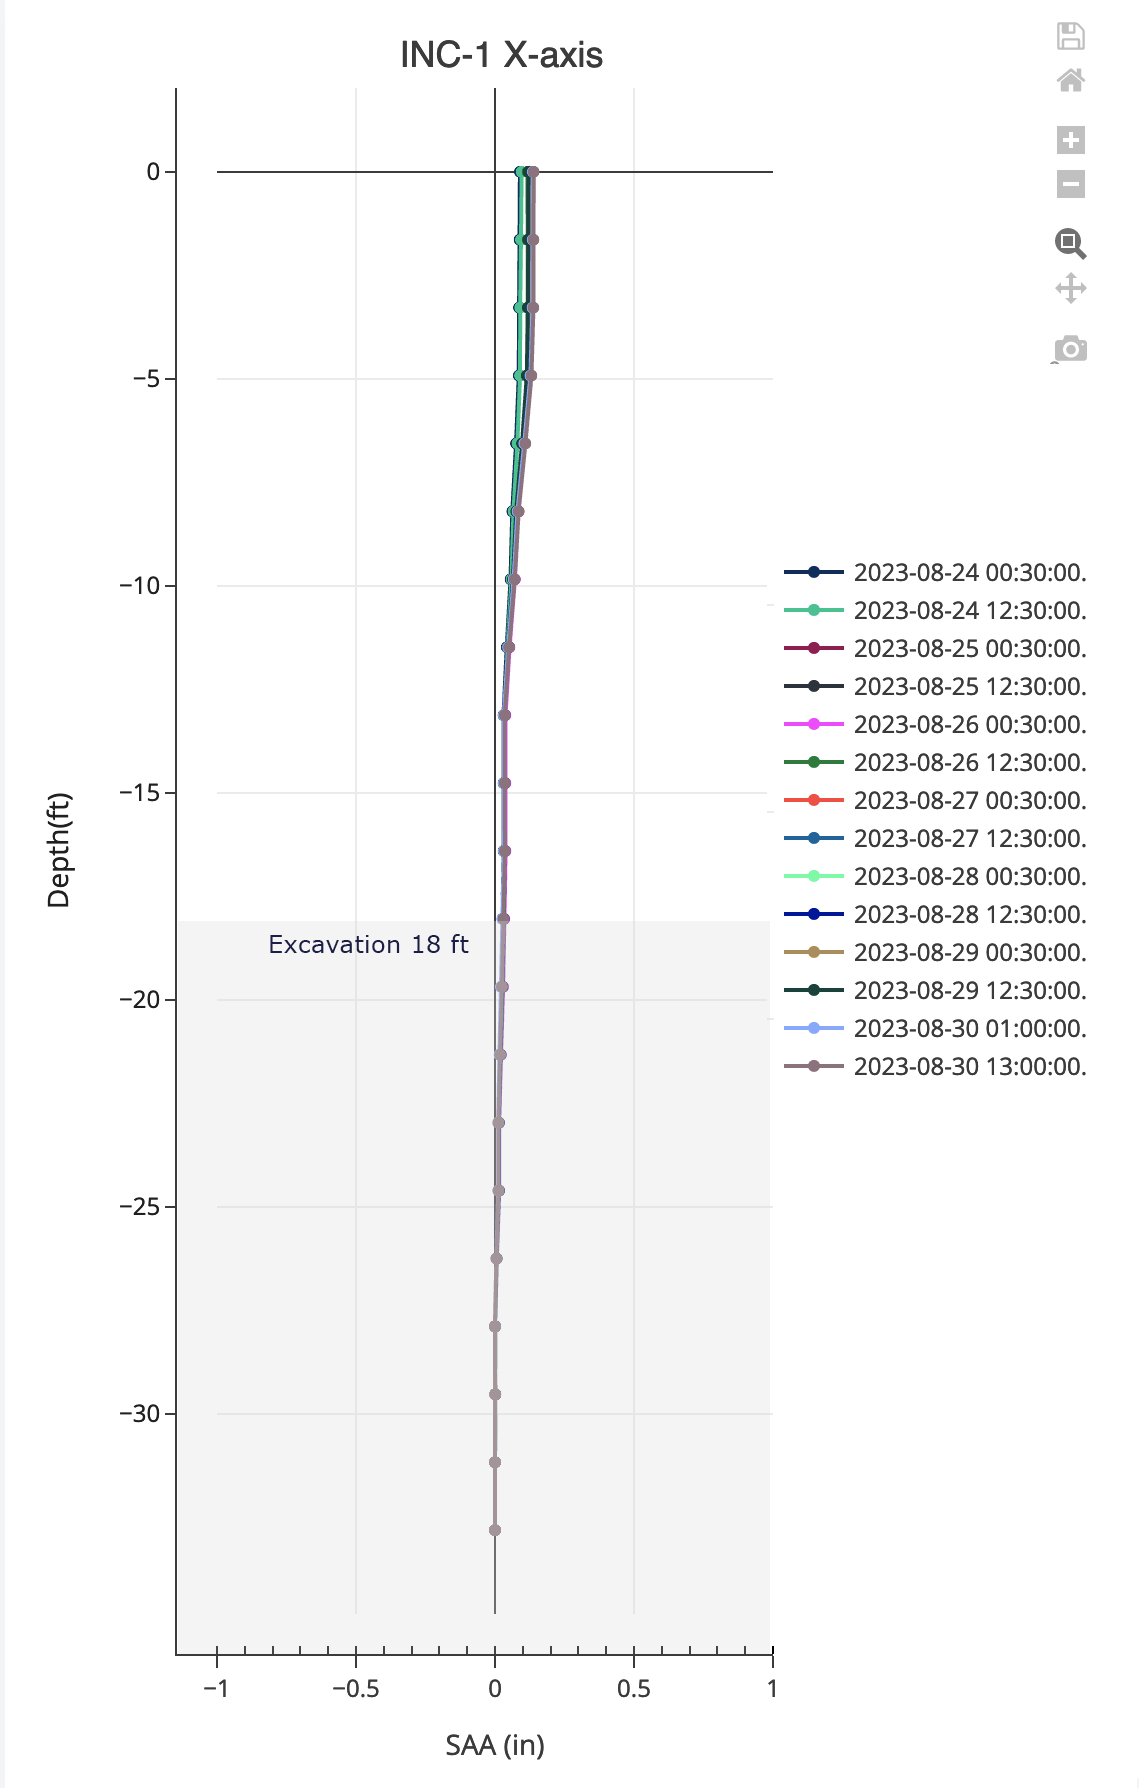
Displacement Profile Plot
Alarms & Reports

Alarm Table: Apollo supports multiple alarm thresholds. Alarms are logged in an alarm table, displayed on planviews, and shown in graphs. Alerts are sent to specified personnel by email and text message.
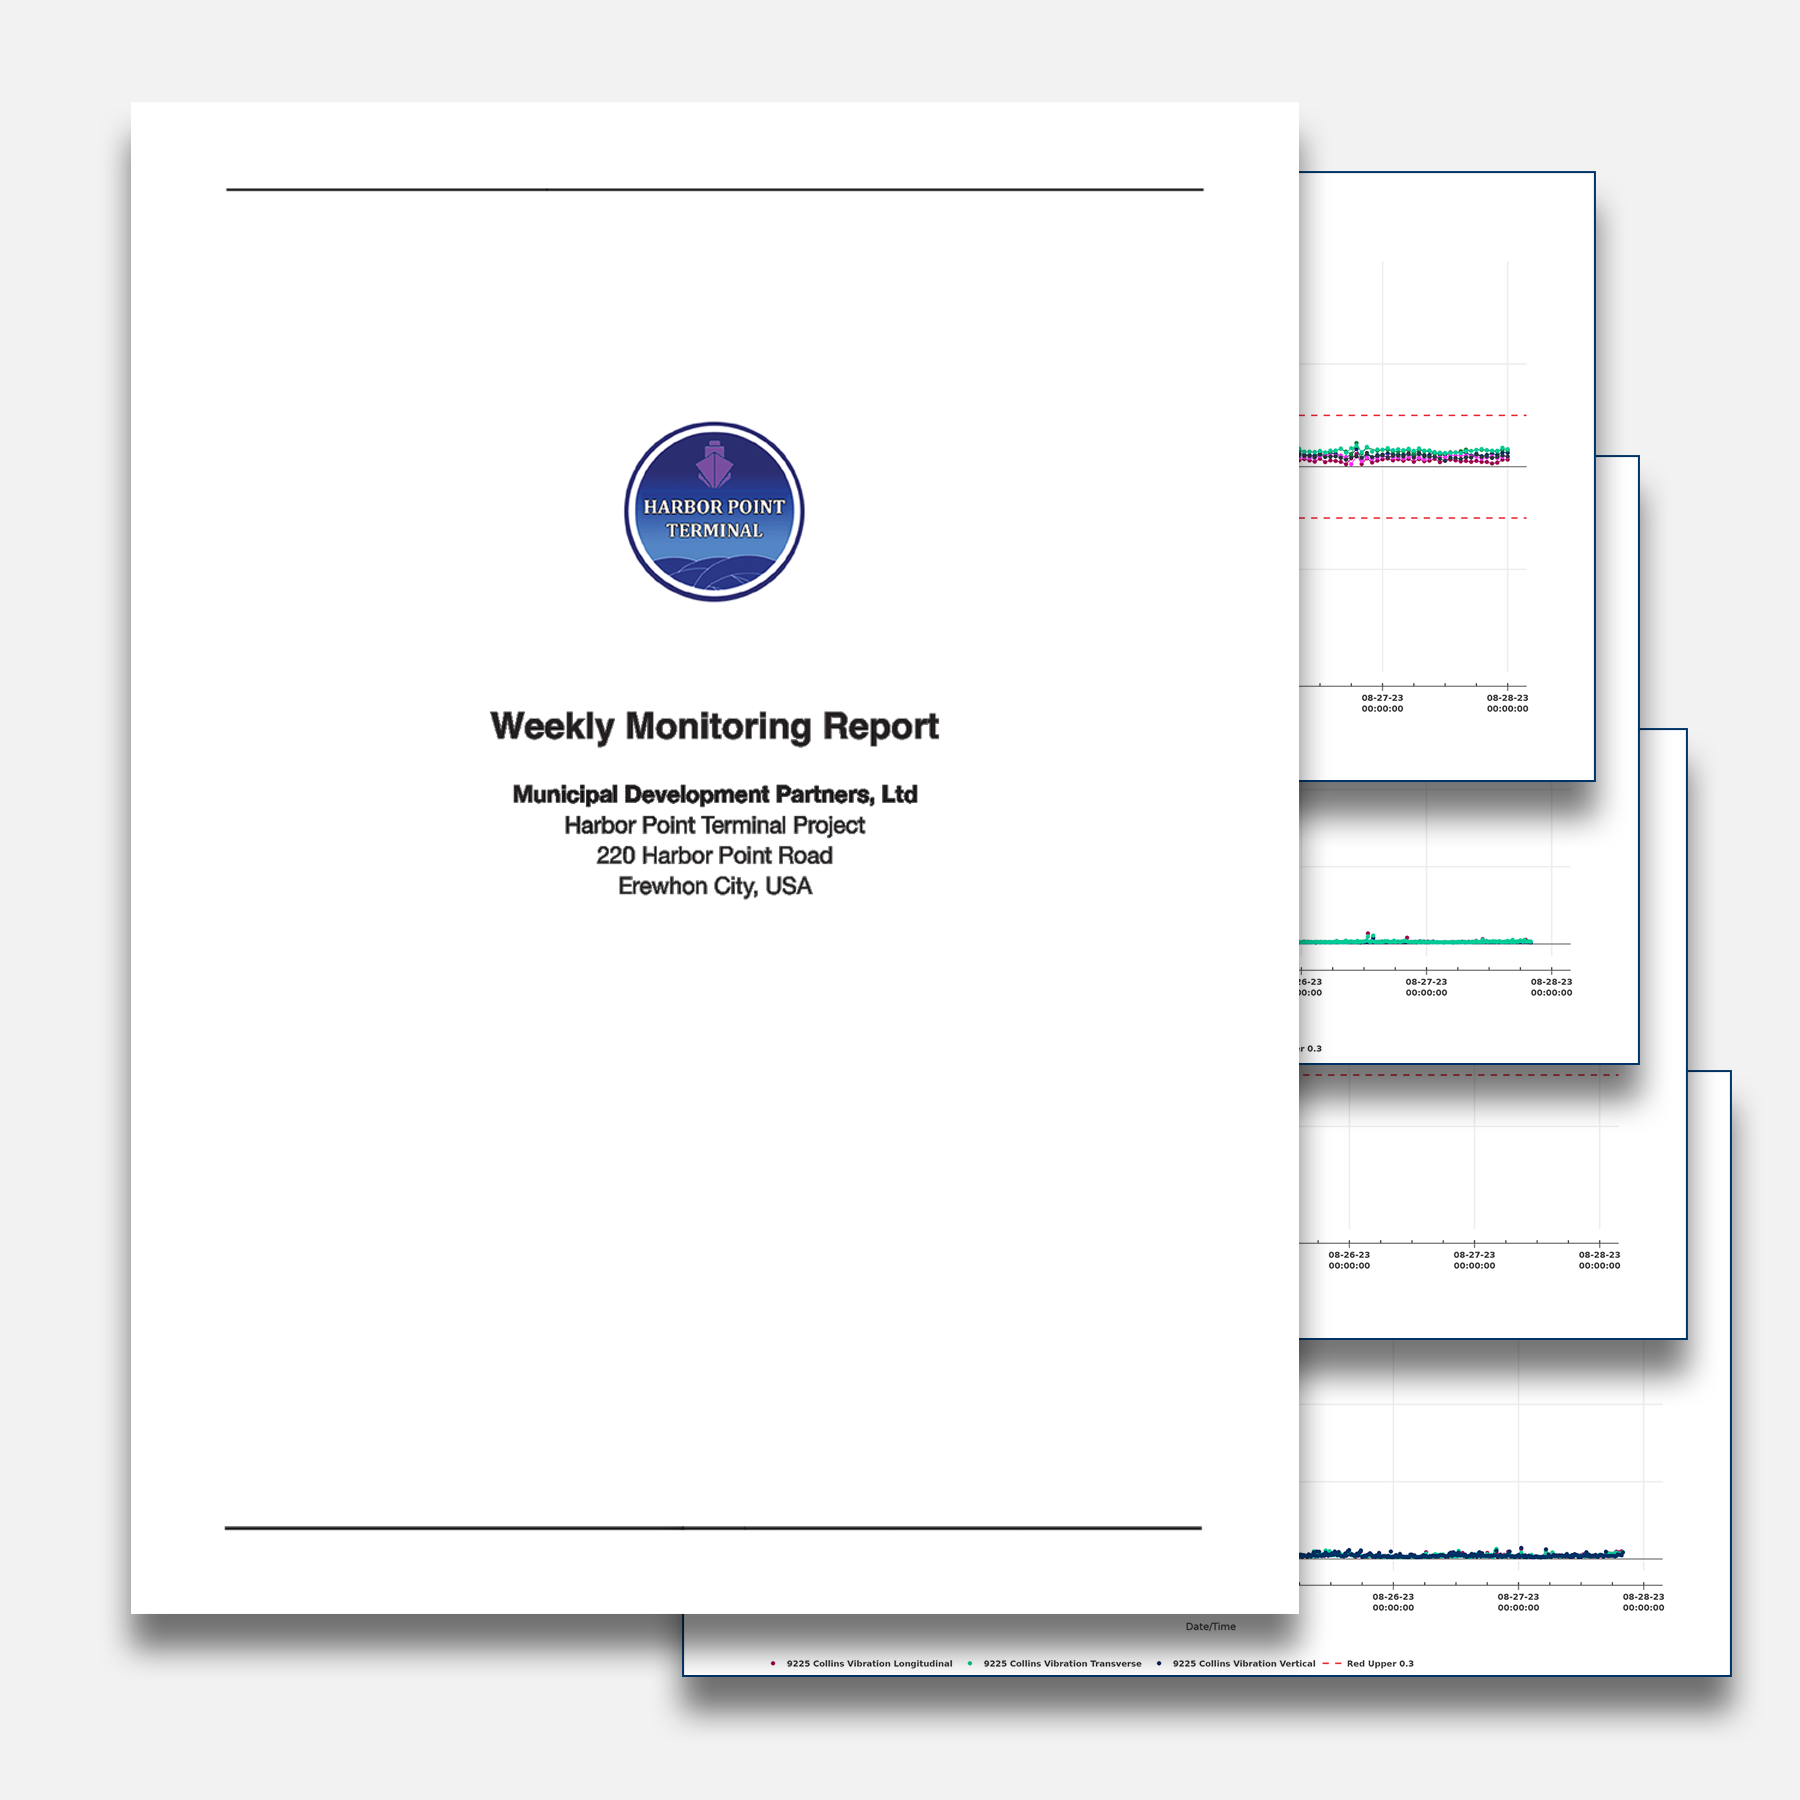
Reports: Preconfigured reports are generated automatically at scheduled intervals and emailed to stakeholders.
Features
Data Ingestion & Processing
Apollo is designed to handle multiple, incoming data streams simultaneously and fully supports efficient use of modern data acquisition devices.
Specialized import modules activate to receive and format incoming data with no queuing delays.
Stored data is processed as needed when a graph or planview is displayed.
Processing instructions can reference multiple sensors and apply most math functions.
Each sensor can be assigned its own datum reading, processing instructions, Y-axis scales, and alarm thresholds.
Planviews
Planviews show sensors and their current readings superimposed on a graphical base layer.
Sensors and readings change color to show alarm status. Time stamps change color if data is missing or overdue. Clicking on a reading calls up a trendplot.
GIS maps used as base layers can be toggled between satellite view and street view. Sensors are placed on the map using GIS coordinates.
Photographs and CAD drawings converted to image format can also be used as base layers. Sensors are placed using pixel coordinates.
Planviews can be zoomed and panned. Sensor types can be toggled on and off for easier viewing of densely instrumented sites.
Graphs
Project graphs are preconfigured to include specified sensors. These one-click graphs display instantly and are also used in reports.
Custom graphs are useful for adhoc investigations and allow users to freely select sensors and settings.
Shared features include:
- Color-coded lines show alarm thresholds.
- Sensors and alarm lines can be toggled by clicking in graph legend.
- Two Y-axes supported.
- Adjustable date range
- Zooming and panning.
- Displayed data can be exported as CSV text file or as a PNG image file.
- Update toggle allows new readings to be plotted on graph while it is viewed.
Construction Vibration Plots
- Velocity vs Frequency graphs with optional USBM/OSMRE limit lines.
- Histogram plots
Shape Array Profile Plots
- Vertical and horizontal displacement plots for shape arrays.
- Boring log and excavation depth can also be displayed.
Alarms
Data Alarms trigger when reading values cross preset thresholds in either direction.
Thresholds can be fixed-values or equation-based values.
Colors can be assigned to each threshold.
Watchdog Alarms trigger if measurements are not received at specified intervals.
Alarm Log records all alarms. Each record consists of a date stamp, the device that triggered the alarm, the trigger level, the triggering value, alarm acknowledgement, ID of person acknowledging, and any comment.
Alarm Messages are sent to specified users by text or email. Messages contain device name, time stamp, data value, and threshold crossed.
To avoid excessive alarm messaging. Apollo sends just one message when the alarm threshold is crossed. Also, users can request spike filtering to suppress messages for n spikes over a set period of time.
Reports
Reports are preconfigured to client specifications and include a cover page followed by any number of graphs.
Reports are compiled as PDFs and email to selected users at required intervals.
