Thermal Integrity Profiling
Thermal Integrity Profiling (TIP) is a non-destructive test method for assessing the quality of cast-in-place concrete foundations, such as drilled shaft and auger cast piles. Datasheet
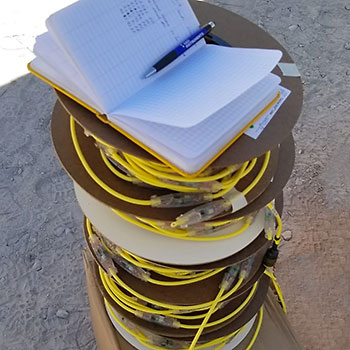
TIP cables, also called “thermal wires,” are supplied on reels. Temperature sensors are fitted at one-foot intervals along the full length of the cable.
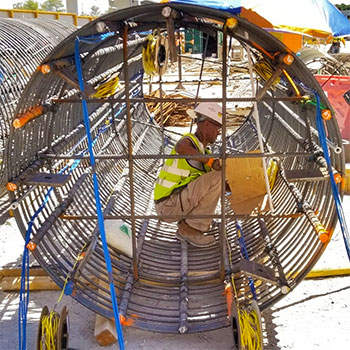
TIP cables are tied to the rebar cage. The number of cables is related to the diameter of the cage.
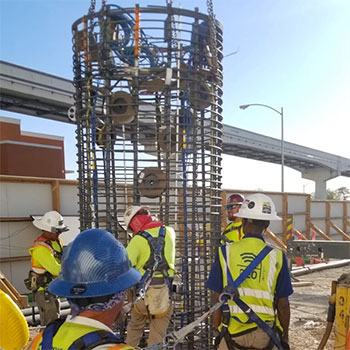
Installation of the cage. Early TIP results will be available within 12 hours of concreting. Final results within 72 hours.
Application
Using temperature measurements of the curing concrete, TIP can identify necking, bulging, cage eccentricities, pile shape, and variations in concrete cover.
Services
GEO-Instruments supplies the TIP equipment, assists with sensor installation, monitors the testing, and produces the reports.
Services are performed to ASTM D7949 Standard Test Methods for Thermal Integrity Profiling of Concrete Deep Foundations.
Advantages
Better Data: TIP allows assessment of the entire shaft, the alignment of the cage, and the concrete cover.
Shorter Test: TIP results are usually available before traditional tests can even begin. This significantly shortens the delay between shaft construction and shaft acceptance.
On-Site Analysis: Defects can be identified within hours after concrete is placed.
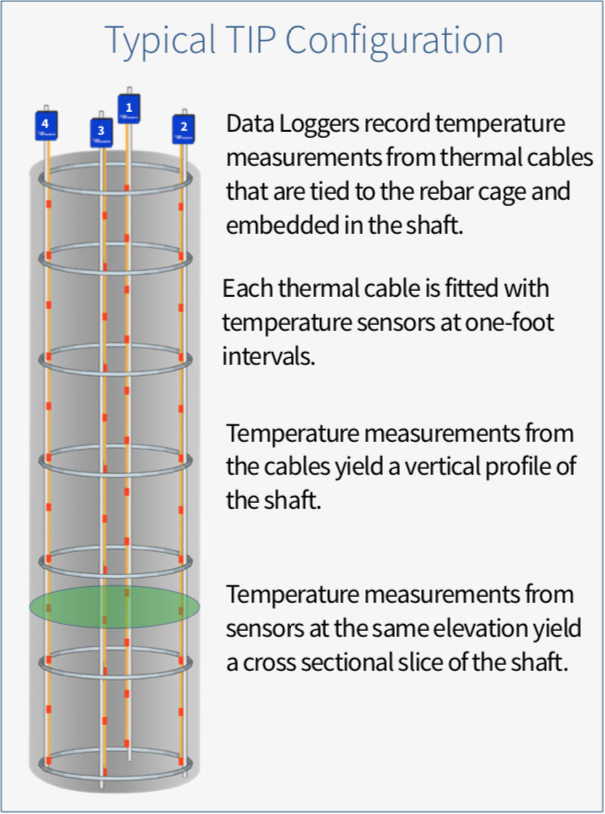
Simple Installation: Thermal cables are attached to vertical elements of the cage with cable ties. No access tubing is used.
Automated Readings: Loggers collect data at frequent intervals. Once started, the test can be run without direction from an on-site engineer.
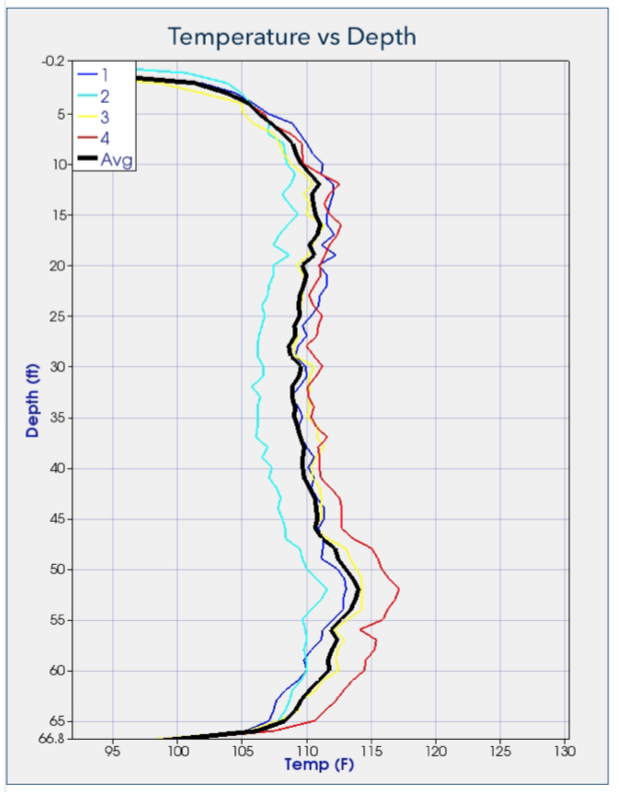
Temperature vs Depth plots are available within 12 hours of the pour. Uniform temperatures indicate a shaft with no significant defects.
Cooler than average temperatures indicate possible necking, inclusions, or poor quality concrete. Warmer than average temperatures indicate possible bulging.
Cooler vs warmer measurements from cables on opposite sides of the cage, as seen in cables 2 and 4 above, indicate cage eccentricity.
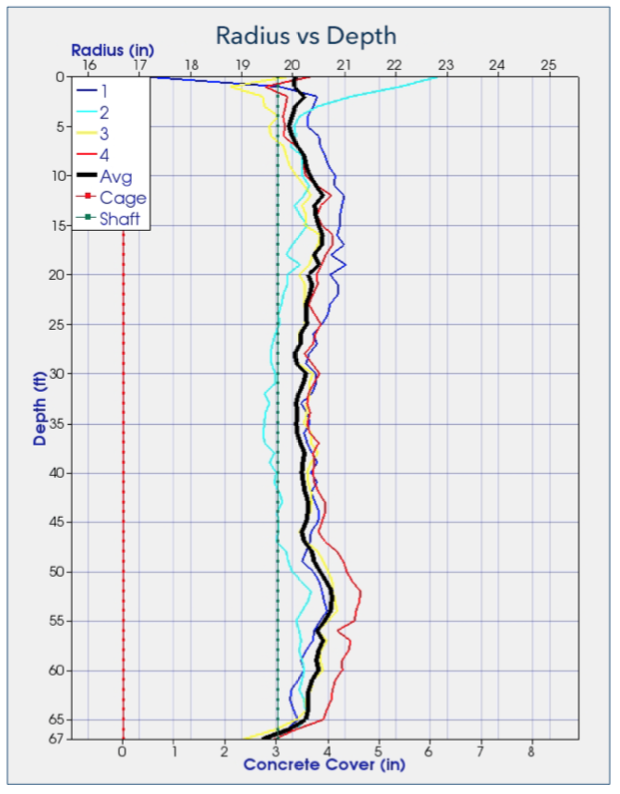
Radius vs Depth plots display the cage, the designed radius of the shaft, the computed radius of the shaft and the computed concrete cover.
Radius calculations require input of the volume of placed concrete. Corrections for temperature rolloffs at the ends of the shaft have been applied as well.
The black line shows that the average effective radius of the shaft exceeds the designed radius. However, cable 2 reveals reduced cover between the 25 and 40 foot depths.
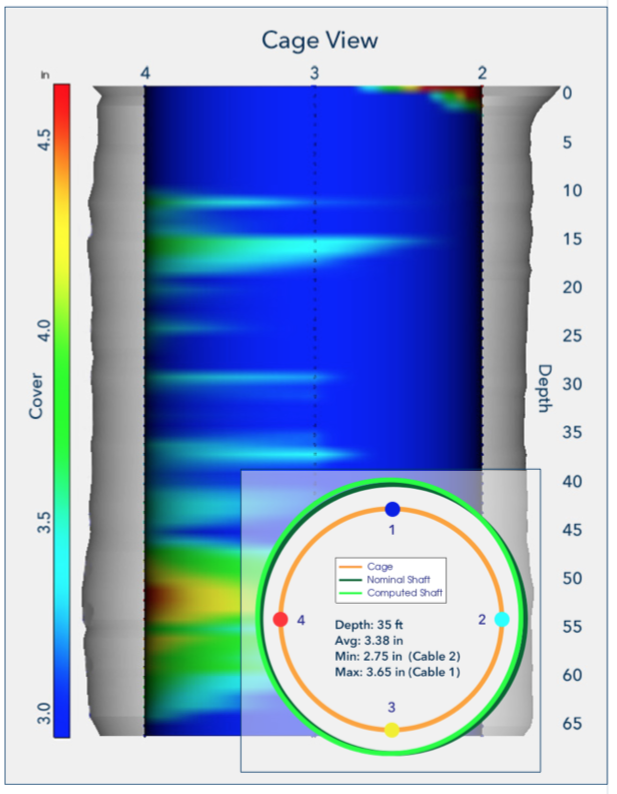
Cage View and Slice plots are derived from the cross sectional data. Cage view plots can be rotated to inspect different sides of the shaft.
The Slice taken from the 35 foot depth shows a minimum cover of 2.75 inches in the vicinity of thermal cable 2, which is also visible in the cage view above.
Thermal Integrity Profiling Datasheet
